The Advanced Analytics team makes up 6% of our (over 200 strong) head count, meaning that 6% of people at Dig are dedicated to developing new and better ways of using data. This includes embedding AI into our workflows, rescaling scoring to ensure a more reliable prediction of in-market success, and exploring potential future improvements in data quality and collection. Thanks to our Advanced Analytics team, we have tools like Upsiide’s Idea Map and patented Market Simulator, Virtual Market, Virtual Menu, and numerous custom tools.
Most recently, the team built an entirely new methodology to account for the “frequency” piece that is often missing in TURF analysis. Introducing, our proprietary Share Optimization Model, or ShOp.
What is TURF, and where does it fall short?
TURF (Total Unduplicated Reach and Frequency) analysis is something that most researchers perform to model an optimized portfolio. It’s interesting now, decades after TURF was created, to consider whether it’s still the best solution.
TURF has its origins in the media planning world, long before it was adapted to marketing research applications. As the name of the technique suggests, the goal for media planners and TURF was twofold: to maximize Reach (the percent of the target audience that sees at least one ad) and to maximize Frequency (the average number of exposures or number of times the ad is seen by a member of the target audience). As this technique was adopted and adapted by the research industry, the focus became Reach (often defined by the percentage of consumers who want to buy one of your offerings), and the Frequency part of the formula (how often consumers will buy your offering) often disappeared.
The core issue with TURF is an underlying assumption that maximizing Reach will also maximize Share. We assume that all products are bought with the same frequency. However, we intuitively know this isn’t true. There are many products that we buy infrequently while others are core staples that we make sure we always have on hand. TURF treats these two types of products equally (because you buy both), but our clients generally want to be staples, not occasional choices.
Our Advanced Analytics team has been experimenting with a fresh way to approach portfolio optimization, one that evaluates both Reach (the percentage of consumers who want to buy each of your offerings) and the Share of Choice that consumers allocate to each product that they buy.
While TURF certainly has its place when Reach is the primary objective, we felt that there was an opportunity to create something that better forecasts the potential of product innovation.
Enter, ShOp – our brand new share optimization model.
What is ShOp?
ShOp, or our proprietary Share Optimization Model, is the ideal solution when your objective is to optimize share for a portfolio of products (brands, flavors, sizes, formats), compared to TURF’s usefulness for maximizing Reach (penetration). Because ShOp focuses on identifying opportunities to drive additional purchases as well as drawing in additional buyers, ShOp typically identifies a broader optimal portfolio than TURF.
Determining the optimal portfolio size becomes less theoretical with ShOp because the focus is incremental share, which can be easily translated into unit volume and revenue to assess return on investment for expanding a portfolio.
How does ShOp work?
ShOp is a proprietary Dig Insights modeling technique and is the ideal solution when the objective is to optimize share for a portfolio of products (brands, flavors, sizes, formats).
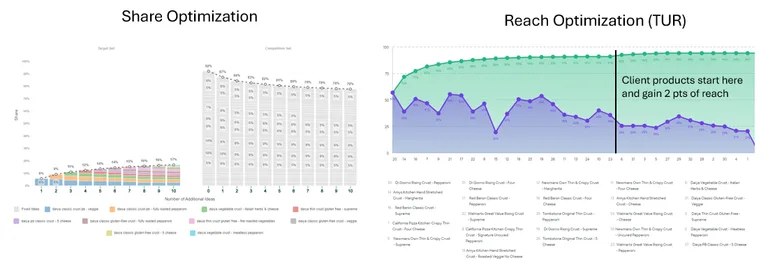
To efficiently maximize share, ShOp:
- Starts with the product that has the most forecasted share
- Adds products one at a time, factoring in cannibalization and incrementality to identify the product that adds the most incremental share
ShOp enables a business-focused approach to determine the optimal portfolio. The output from ShOp is share, which can be readily translated into unit volume and revenue to assess return on investment for expanding a portfolio.
Benefits of using ShOp, vs a traditional TURF model
Depth of preference
TURF focuses exclusively on Reach. Because of this, TURF models often recommend including niche items that appeal to a unique cohort of consumers. These niche items are often unsustainable in market because they are bought infrequently. Because ShOp factors in depth of preference (how frequently an item will be bought), it avoids recommending overly niche items.
Competitive context optimization
TURF analysis is rarely done in a competitive context because if you start with a competitive scenario, then you’ve probably already reached almost everyone. This highlights the fatal flaw in TURF analysis: the lack of any mechanism to switch between products. This is done natively with ShOp because when you add a new product to a portfolio, the shares (including cannibalization and incrementality) are calculated anew each time. This means ShOp can start with a competitive context and optimally add in your products one by one.
Statistical Superiority
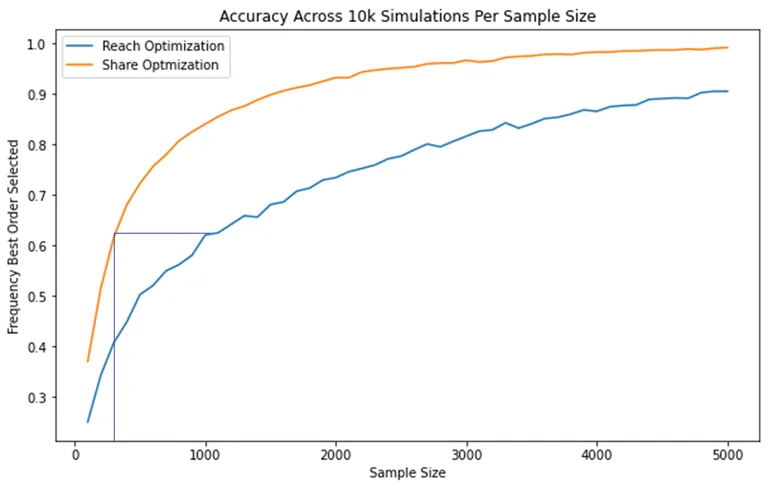
Shares of preference are naturally more numerically stable than reach. This means that the results are more replicable with ShOp than they are with TURF. To demonstrate this, our advanced analytics team simulated millions of hypothetical scenarios for each method using synthetic data with a known ground truth or answer. See the chart below. This shows that, with any given sample size, you are much more likely to capture the optimal portfolio with ShOp than with TURF. This happens because TURF simplifies everyone to just “reached” or “not reached” and misses out on the nuance that some people are “on the fence” about buying something. ShOp handles this by giving us a specific share as a percentage, which is continuous, smooth, and “more mathematically stable.”
Growth Opportunity
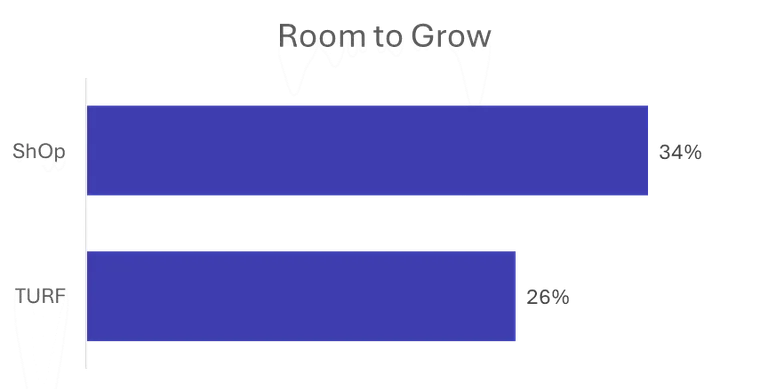
ShOp allows for more room to grow the category compared to TURF analysis. TURF analysis saturates markets with much fewer SKUs because the only way to grow is via capturing a new, unreached customer. ShOp offers another path towards growth: deeper preference.
To demonstrate this, we ran a meta analysis with 30 recent Upsiide studies using both TURF and ShOp and found that ShOp has a higher growth ceiling than TURF (34% room to grow vs. 26%). This is more in line with our clients’ expectations and the current realities of stores where large categories can sustain numerous SKUs.
What this means for a typical study is that there will be more room for additional SKUs in your model before market saturation, which aligns closer with the reality of store shelves laden with products.
Business Goal Alignment
Typically our clients are focused on growing their volume, which means growing the category and their share in the category. Maximizing Reach (penetration) or Frequency are both means to this end. ShOp addresses this reality effectively, building portfolios designed to optimize for both of these criteria.
TURF vs. ShOp Case Study
Using a stand-in brand of sparkling water available in the US, we wanted to explore how TURF and ShOp would build an optimal 5-SKU portfolio, drawing from eight potential SKUs.
When building a 5-SKU portfolio, TURF and ShOp give similar recommendations: four of the five SKUs are the same across the two models. One important difference emerges: ShOp ranks Watermelon as the most important SKU for driving portfolio volume. TURF does not prioritize Watermelon. This is because TURF is designed to maximize reach, and ShOp is built to maximize share.
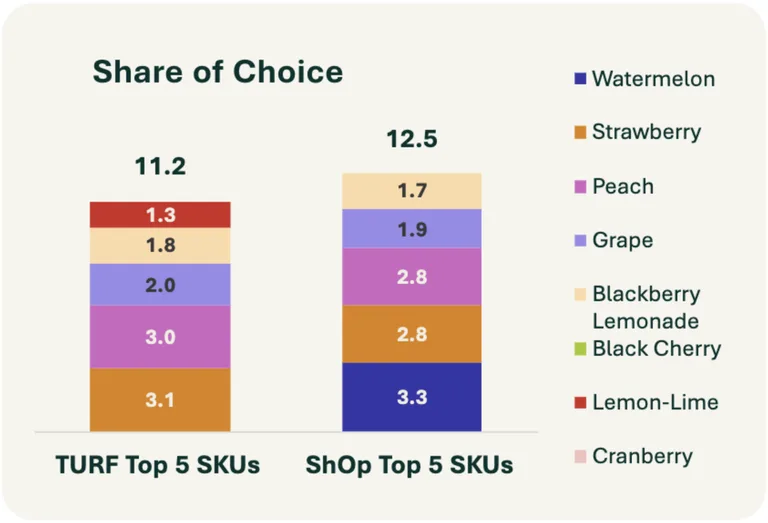
As a result of this difference, the ShOp-optimized 5-SKU mix is forecasted to have a 12.5% share while the TURF optimized 5-SKU mix is forecasted to have an 11.2% share.
This share difference of 1.3% in the context of the Flavor Sparkling Water market (800 million units) would translate into a difference of about 10.4 million units.
There is the additional risk that Lemon-Lime (which TURF recommends including) has a share of only 1.3%. Low velocity SKUs like this are at risk of de-listing, which could lead to further share erosion.
Want to learn more about our new methodology?