LinkedIn is often the place we go to read inspiring stories and find thought-provoking content about our industries or work. A while back, this image was circulating on our feed:
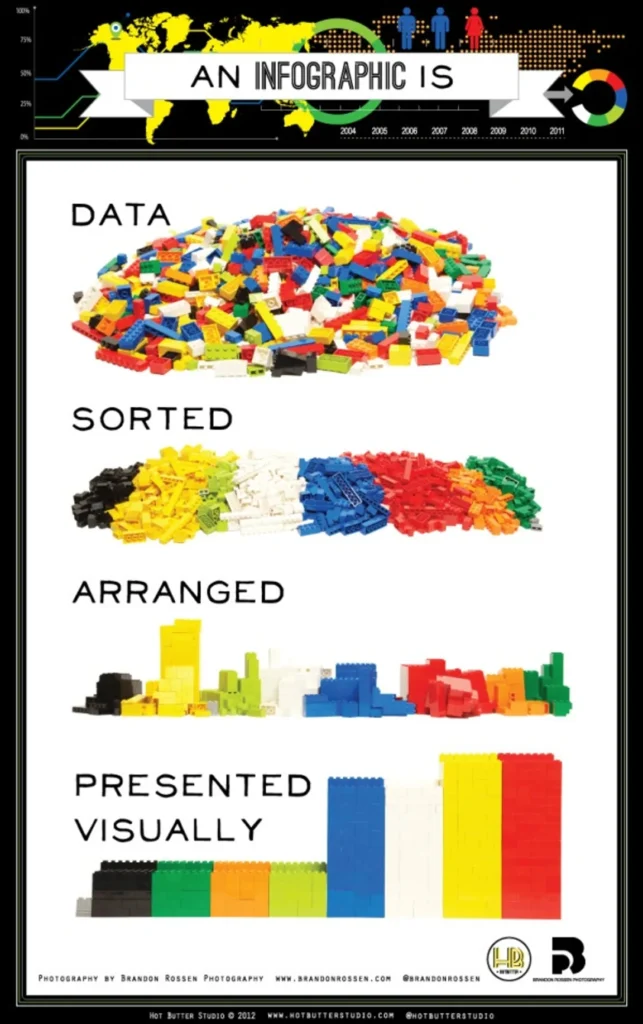
The picture illustrates how data becomes easier to digest if it is presented in an effective way. For us, it’s striking because it summarizes a part of the task of working in research, which is essentially consolidating data and interpreting it effectively.
But what happens with data after it is interpreted? We all know that the process doesn’t end there.? Here’s the missing piece:
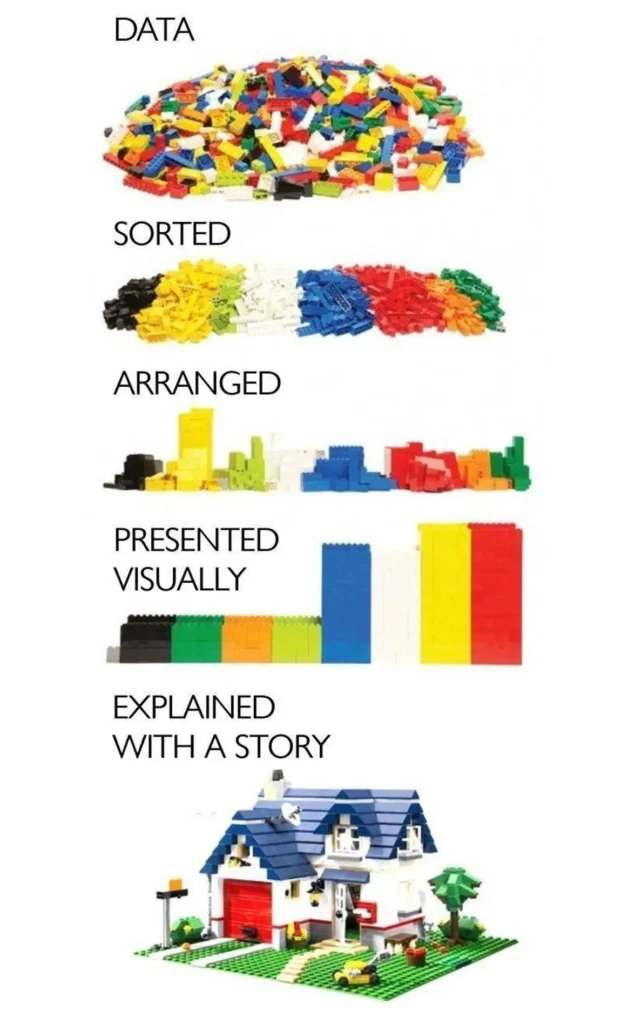
The completed picture shows you the power of research – data has little meaning unless it tells a story. The story should engage, get you excited, and most importantly – drive human-centric decision making.
Telling a concise, coherent story is what separates good research from mediocre research. And the thing that kicks the story up a notch is when it speaks to business impact. But telling a data-driven story that relates to business impact is often done poorly for many reasons.
The challenge of aligning research with business impact
There are several problems that research pros face when trying to build a coherent story out of data.
1. The story isn’t clear
Why do we need stories to communicate research findings? Because we want to act on the insights, and when they’re divorced from the reality of a specific business, it’s challenging to do so.
Let’s revert back to the image above: you might be asking, “isn’t visualizing the data the same as telling a story about the data?”. While these two things are closely linked, they build on each other as opposed to existing in isolation. Visualizing the data is crucial in order to interpret it, but it’s the story that comes out of that interpretation that puts the data in the context of the business and infuses meaning into the insights.
2. The story isn’t actionable
When a story doesn’t have clear recommendations or next steps, it’s incredibly challenging to develop a strategy.
This problem haunts many companies that are attempting to innovate and grow. Forrester reports that while 74% of firms state they want to be “data-driven,” only 29% say they are successful at connecting analytics to action.
So how do you make sure that your story is actionable? Make it speak to hard numbers and revenue projections. For example, don’t tell your innovation or category teams that a particular flavor profile performed well in research. Tell them that that particular flavor profile would increase incremental revenue for the brand by X%.
The actionability of the insights relates directly to how it can impact business decisions. If the insights can’t do that, then they are in fact not insightful. If the data or information can unlock an insight that relates directly to or has implications on the business in a meaningful way, then we can action those insights.
Paul Gaudette, CEO
Dig Insights
3. The story isn’t specific to your business
Great storytelling in research is hyper-relevant to your company. There’s little use presenting a research-led story back to your business if it doesn’t take into account the unique context you operate within.
For instance, we recently tested different limited-time offers (LTO) of large quick-serve restaurant (QSR) chains to see which ones consumers intuitively like best. One of the things we discovered was that Tim Hortons’ LTO was very popular in Canada, but didn’t perform so well in the US.
But it doesn’t mean that Tim Hortons should avoid LTOs in the US. The data appears to simply mirror the brand’s presence in those countries: Canada has 4,286 Tim Hortons stores, and the US has 609. This suggests that US consumers chose Tim Horton’s offering less because they haven’t been exposed to the brand to the same extent, not because they intuitively like the offers less.
While a very small example of a larger problem, this contextual nuance illustrates that a story must consider the wider business context to be useful.
4. The story is difficult to share across the organization
How likely is your team to read a 50-page PowerPoint presentation? What about scroll through row and row and column after column of an Excel spreadsheet?
Given many of us are working remotely these days, and given the speed at which we need to make decisions and digest information, it’s crucial that we’re presenting a clear story in the most concise and engaging way possible. Why not try sharing a video that illustrates the story you’re trying to tell, or condense the data down to a 5-10 slide deck for subject matter experts to share in a planning meeting? It might mean spending a bit more time on the outputs, but we can guarantee that it’ll make for better business decisions and growth.
How to align storytelling with business impact
The above reasons illustrate why data-driven storytelling often fails. As an insight and strategy consultancy, we’re passionate about mitigating these challenges, delivering research-led stories that are specific to our clients’ unique business contexts and speak to volume and revenue.
Paul comments on why storytelling that relates to business impact is so important at Dig:
Our clients are constantly bombarded with data from all types of sources – internal metric data, trend data, research data, transactional data, social data – it can be overwhelming. Connecting the dots and uncovering the story within the data is at the core of why consumer insights are so important. The story you craft gives the data meaning and value, and almost more importantly, how that story is told is what energizes the team and drives strategy.
We constantly aim to ensure that the story we tell, and the insights we provide, are those that will have a direct impact on our clients’ business. This is why we have spent a significant amount of time developing our own internal analytics tools, our own innovation testing platform, and our own data visualization techniques so that we can pull out and showcase the relevant insights that our clients need and make them easy to understand. We also aim to speak the language of our client’s business – putting insights into perspective. For example, how it may impact sales and profitability, how it may impact brand and customer loyalty, how it may impact strategic goals. This approach lets our clients know we understand their business and what’s important to them.
Paul Gaudette, CEO
Dig Insights
Leveraging smart technology and analytics
We’ve created a suite of analytics tools that identify which ideas are worth pursuing, but also what those ideas will be worth (think $$$) to your business. .
Our technology was built hand-in-hand with research pros, and takes into account consumers’ shopping experiences to demonstrate real business impact.
Share of Choice
To identify which innovation ideas have the potential to grow category penetration or to achieve significant market share, we model Share of Choice.
Let’s imagine you’re a retailer who wants to sell a variety of brands. How do you know which brands you should bring on board? Share of choice modelling forecasts this for you. As a retailer, you can visualize: if all of the brands were equally available and equally promoted through advertising and discounting, which share would each achieve?
This allows the retailer to predict which brands have the most potential to be profitable. As a brand leader, you can see how you’d perform against the competition. When you present the projected impact of bringing particular brands on-shelf using this methodology, your internal stakeholders clearly understand what to do and the impact of the research. It’s a clear, profitable story for the business.
TURF (Total Unduplicated Reach and Frequency)
TURF tells us the percentage of people that a product can potentially reach and identifies the combination of products that reaches the most of those people.
For example, let’s imagine that a retailer only sells Brand A which means they can potentially reach 39% of shoppers. But if they sell both Brand A and Brand B, they’d now be able to reach 46% of consumers. The percentage of customers reached increases as we add more brands until the results start to plateau. TURF allows you to predict which brands can, in combination, maximize category penetration.
When used with Share of Choice, these two models can help a retailer to identify an optimal brand mix and help a brand to optimize their product portfolio. This kind of analytics crafts a story that takes top-two box scores to an entirely new level, allowing internal stakeholders to clearly visualize the most profitable way forward.
When you nail your research story, you uncover actionable and tailored solutions that’ll make a true impact on the business.