One of the strengths of Dig Insights is our data modeling and visualization. Data modeling allows us to translate research metrics into business metrics like share or source of volume and incrementality, or to recommend an optimized portfolio of products, claims, or benefits.
A critical input to these models is identifying which products, claims, or benefits will trigger actual in-market purchases by consumers.
After extensive data modeling and analytical investigation by our Advanced Analytics team, Dig Insights is enhancing our proprietary Upsiide models by making the definition of ‘purchase’ more restrictive. This results in more refined recommendations on portfolio mix, and improved ability to identify the innovations that will drive the biggest impact in market share and revenue for our clients.
Methodology
Our proprietary Upsiide platform, which focuses on agile idea testing, offers a gamified environment for consumers to identify products, services, claims, benefits, and communications that are engaging (what we call ‘Interest’ or an ‘Interest Score’). Upsiide also includes head-to-head trade-off exercises that allow consumers to identify ideas that they prefer versus competing alternatives (what we call ‘Commitment’ or a ‘Commitment Score’). In addition to analyzing Interest and Commitment independently we combine these two measures to create a single overall Idea Score, and model the raw data to identify products, services, claims, benefits, and communications that have the potential to drive purchase.
Typical Upsiide studies identify multiple ideas that appeal to consumers. However, not all appealing ideas are purchased in market. Since Upsiide’s launch, the Dig team has continued to refine and test both our Interest and Commitment modeling and how we translate these scores into forecasts of share, source of volume, and incrementality. Our goal is to ensure that we are forecasting in-market purchase behaviors as accurately as possible.
As part of our efforts to continuously improve our forecasting models, we examined over 60 Upsiide studies that included both our proprietary Interest and Commitment exercises and a common 5-point purchase intent question where the response options were definitely will buy, probably will buy, might or might not buy, probably will not buy, definitely will not buy.
The goal was to understand the relationship between top-two-box purchase intent (the percentage of consumers who say they definitely will buy or probably will buy) vs. the stricter measure of top-box purchase intent (the percentage of consumers who say they definitely will buy).
Our previous underlying model was consistent in magnitude with the broader top-two-box purchase intent metric. We wanted to rescale our algorithm to move our model closer to the more restrictive top-box purchase intent metric. We believe that this stricter measure better identifies ideas that will generate in-market purchase.
Results
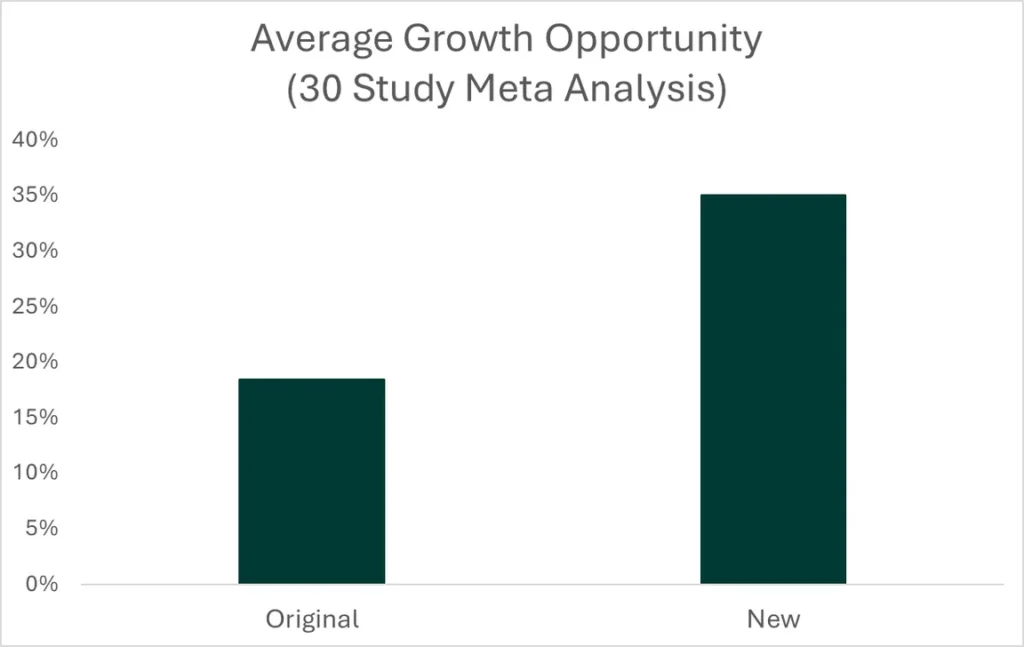
We ran a meta-analysis of thirty studies before and after the modeling update. As shown in chart 1, we found that after the modeling update the average study had twice as much ‘room’ for share of market growth; this meant that our enhanced analysis was more reasonable when it comes to identifying how many offerings are required to achieve ‘market saturation’. Market saturation is when there is no need for additional products, claims, benefits, or messages due to existing options addressing the entire range of consumer needs.
Chart 1: Average growth opportunity (difference between best item’s share to cumulative share of all items)
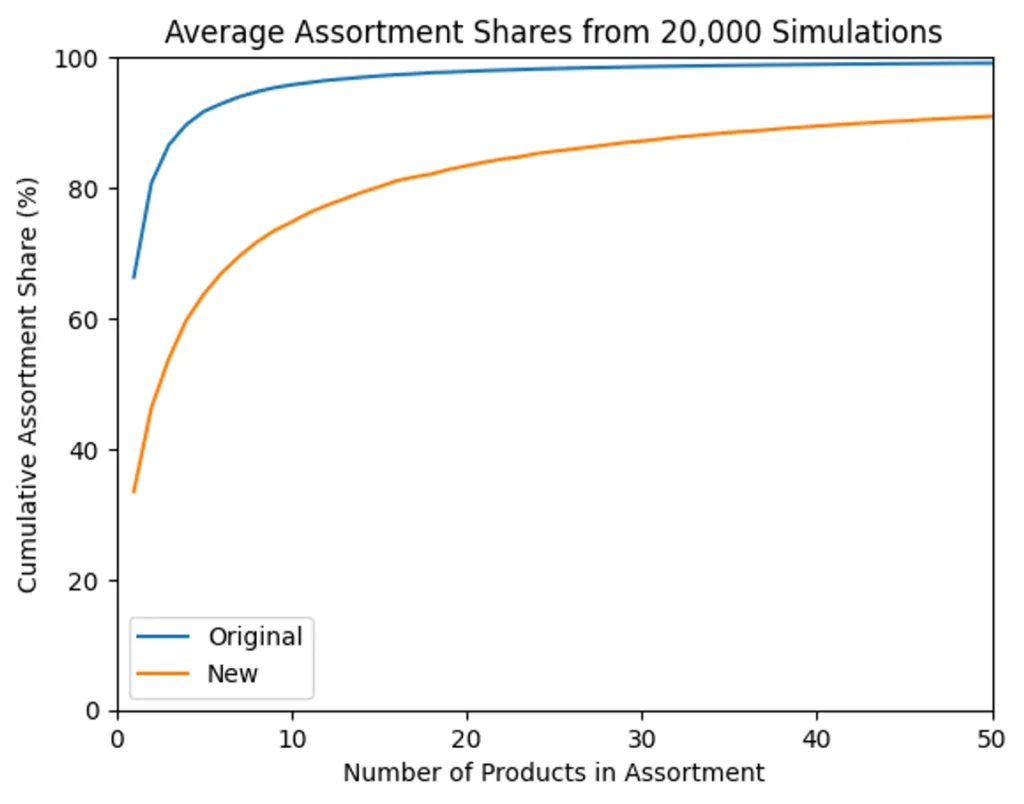
In Chart 2, we show how this applies when we run market share forecasts on Upsiide data. Our previous model showed that market share reached close to 100% with roughly 10 products. Following the modeling enhancements, there is a slower and more gradual rate of market saturation. From a practical perspective, this is a more actionable way for organizations to identify innovations that can grow share or grow the category.
Chart 2: Average assortment shares from 20,000 Monte Carlo simulations
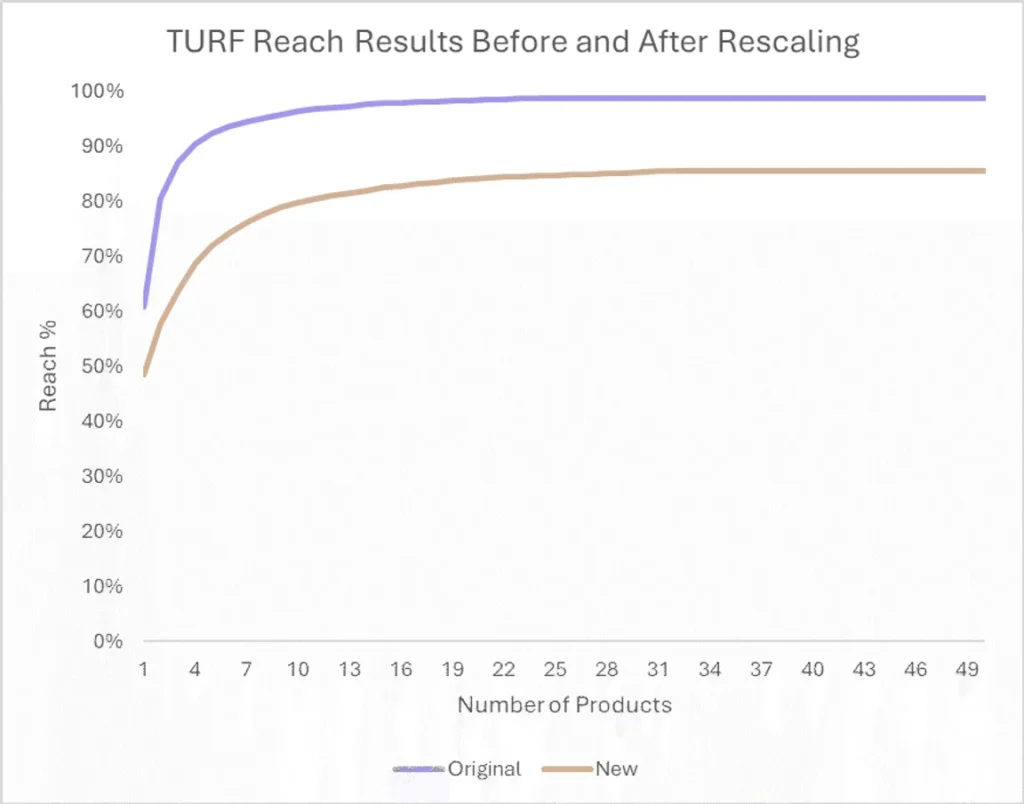
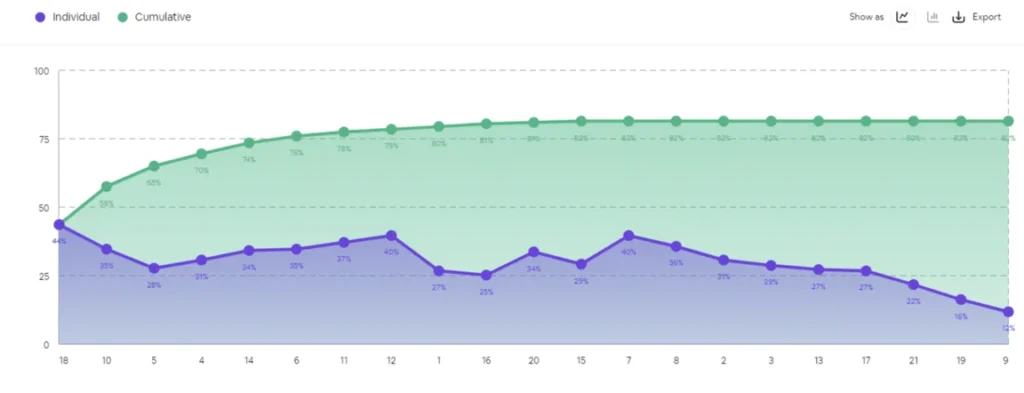
This change also affects the way Dig conducts a TURF analysis. TURF (Total Unduplicated Reach and Frequency) is a well-known market research analysis that identifies the percentage of consumers whose needs are addressed by a mix of offerings, which is also known as ‘reach’. We examined the shape of the reach diminishing returns curve, shown below in Chart 3, before and after our modeling enhancements. The previous approach (light purple) sees reach rise quickly with the first few items and achieve market saturation sooner. As a result, the TURF model indicates that relatively few offerings are required to address the market needs.
In our enhanced approach (orange), our modeling results in a more gradual rise when adding additional offerings to the market model, which is more indicative of true market realities.
Chart 3: TURF Reach by product count before and after the model enhancement.
It’s worth noting that the new individual share (for example, the results provided by Upsiide’s Market Simulator), and individual reach (TURF analysis) metrics continue to be highly correlated to Upsiide’s Idea Score (Pearson’s r=0.97 and r=0.94 respectively). This means that the relative performance of tested ideas is consistent across the previous and enhanced models; however the enhanced model provides improved mix modeling opportunities while preserving relative item ranking.
What’s changed, and what hasn’t
There has been no change to Interest, Commitment, or Idea Scores. This change affects Market Simulator (image 4) and TURF Analysis (image 5). The change went live on the Upsiide platform as of Dec 13, 2023.
Image 4: Market Simulator
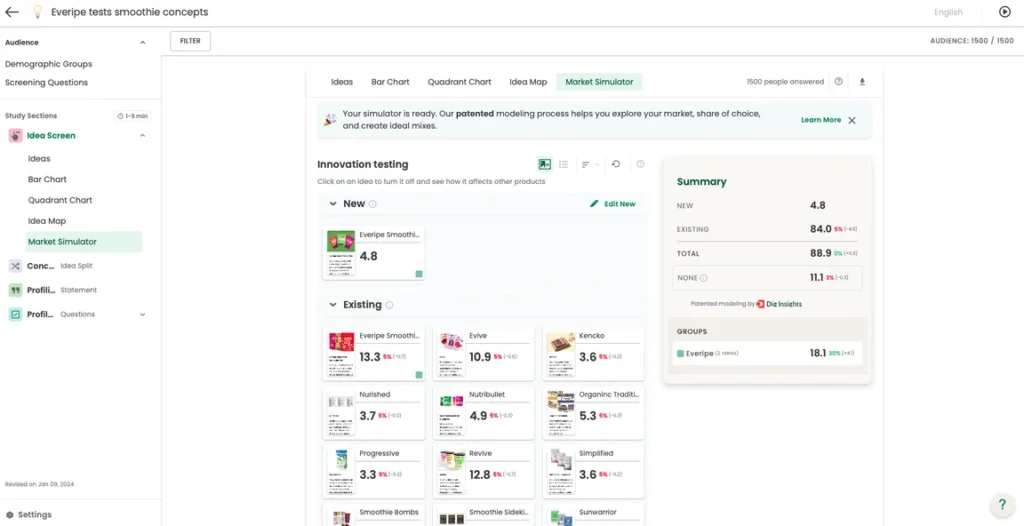
Image 5: TURF Analysis
Impact and Benefits
The result of our more restrictive purchase threshold is that there are more consumers forecasted to buy none of the options in Market Simulator (identifying more opportunity for innovation to grow share or grow the category) and lower ‘reach’ in TURF (identifying more opportunity for innovation to grow penetration).
Summary
By updating the data modeling on Upsiide, we have improved the ability of Interest and Commitment scores to forecast in-market purchase. This change allows for improved mix modeling and better forecasts of the ability of tested innovations to drive incremental growth.