You’ve done your work. You decided to launch an innovation (say, a new product). You spent weeks crafting your market research project with an agency. You finally launched a survey to find your winning innovation idea.
The survey is complete. You finally go in and have a look at the results. What do you see? Numbers. A lot of numbers.
As you scan through rows of data and inspect each chart, questions spring up in your mind.
“What does this number mean?”
“How can I use this bar chart to make a decision?”
and finally…
“Is the score I’m looking at good at all?”
At the end of the day, what matters the most is knowing whether the innovation you proposed has the potential to drive growth for your business.
So, how can you answer the ultimate question? Spoiler alert: We can help you. But first, let’s tackle the principle that guides our thinking.
“Choice requires context” or our views on benchmarks.
Benchmarking is a traditional way to measure how you perform against your competitors or similar companies. Typically, it’s a number (e.g. an average) that you would use to compare yourself against.
While benchmarks are still a pretty widely used way to see how your product performs against competitors, we think there are better ways to do that.
If not done properly, benchmarking might make the results less accurate. For example, if a business uses the wrong items to benchmark, it might make that average number bad. This traditional method of comparison also might miss on capturing the uniqueness of a product or solution that is innovating outside of a definable category.
So, how else can a business track its performance against others? We leverage the power of context.
At Dig, we have a set of principles that guide our thinking. One of them is that choice requires context. It means that if you want to learn whether your idea has potential, always test it in the context of other ideas available in the market or against other innovation ideas you might have.
We have a range of modelling techniques and tools that allow us to test a range of ideas against each other – Upsiide is one of them. Upsiide is a restech platform purpose-built by the research experts at Dig to find winning innovation ideas. Tools like Upsiide help us future-proof research because it is based on reliable and accurate data that doesn’t require benchmarking. Every consumer choice is made in the context of other ideas.
Now that we know that choice requires context, let’s explain how to know if you have a good score.
How to answer the question, “Is this a good score?”
To help you answer this question, we will use our work with our partners at The Hershey Company as an example.
With a portfolio of well-established brands in well-established categories, Hershey needed to identify opportunities to use innovation to drive incremental volume growth and grow penetration.
Here is how we helped Hershey answer the big question:
1. Treat a score as just a number on a page
Hershey recently launched a new product, and they needed to understand which brands were the optimal fit for that product.
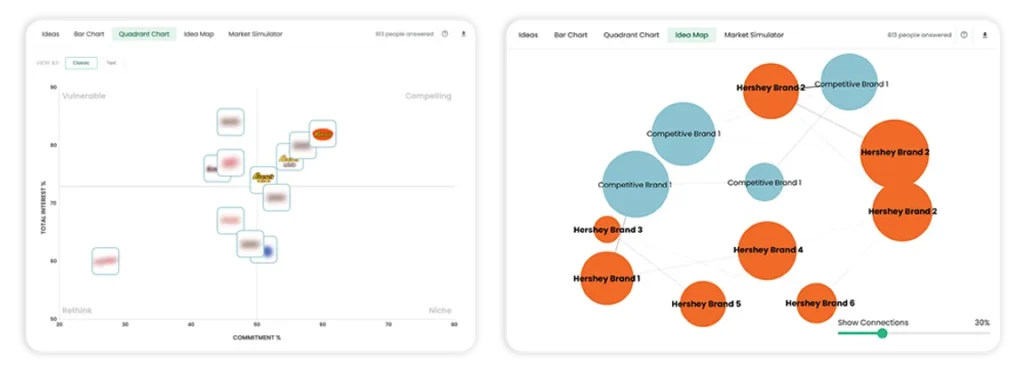
After testing their own and competitive brands on Upsiide, they identified which of their brands were most promising, aka which brands had the best ‘score’. But just knowing a score wasn’t enough to learn about the impact of introducing this new product. That’s why Hershey leveraged Upsiide’s Quadrant Chart and Network Map functionality.

The Quadrant Chart helped them see how they fare against their competition and which brands drive more consumer commitment. The Network Map, in turn, revealed where they might share connections with rival brands and if there might be an opportunity to differentiate.
2. Iterate research to solve for evolving business scenarios
The Hershey Company truly understands the power of iterative research. Before they even dove into the brand research, they conducted several early-stage tests to really narrow down the number of brands they might consider for the new product.
They weren’t just number-hunting to find the best brand with the best score. They wanted to learn which brand should be considered for the new product and why.

Upsiide’s Idea Screen, Assess and Develop survey templates helped them get to the nitty gritty of this research, with templates designed for every stage of the innovation process.
By conducting tests iteratively, Hershey was able to understand not only which brands deserve to be considered for a new product but also why. That’s how they knew whether the score was actually “good.”
3. Add value by showing data in terms of incrementality and share
If you’ve conducted research before, you might be familiar with typical metrics like purchase intent scores or measures on attitudinal scales. But these kinds of metrics don’t always tell you whether your innovation will be actually profitable.
Instead, it would be more impactful if you could show your stakeholders the business-related metrics such as market share, incrementality, or cannibalization and interaction across products. Luckily, Dig has just the right tools for that.
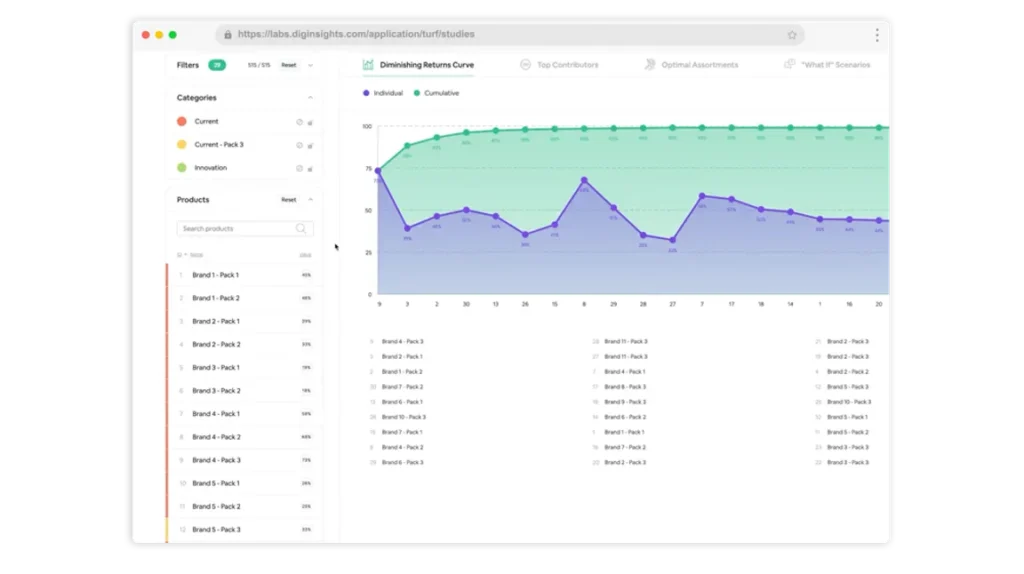
Hershey used Dig’s TURF tool to find the best combination of brands that would capture the interest of the most amount of consumers.

The beauty of TURF is that you can create a whole range of scenarios and combinations in case there are any changes in your brand strategy. For example, if Hershey decides that they cannot optimize Brand 1 for this new product, they can use TURF results to find the next most incremental option that would bring the same market share results.
Another way that Hershey proved the value of their research is by using Upsiide’s Market Simulator tool. They were able to simulate real market conditions, identify how much market share their brands would steal from competitors and see which SKUs would be impacted the most.