In our post, we discussed Starbucks’ famous PSL and how this cult-like drink, which is offered only a few months a year, got to where it is today.
This time, we want to explore another limited-time offer (LTO) launched by Starbucks a few years back. (did we mention how much we love talking about Starbucks?)
Back in 2017, the famous coffee shop chain was looking for a beverage that would attract Gen Z consumers. They thought “Where do these consumers spend most of their time? Social media.” Following this logic, Starbucks created the most “Instagrammable” limited-menu item, the Unicorn Frappuccino.
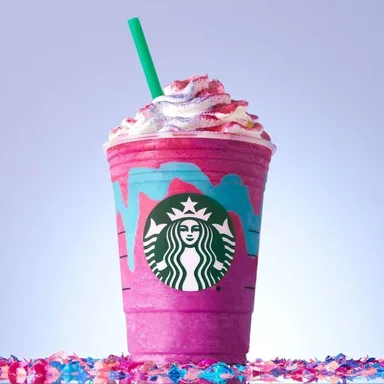
What was it that made this drink successful? Well, compared to the PSL, it wasn’t really the taste – it was about how it looked.
The Unicorn Frappuccino generated about 180,000 Instagram posts in its first week. Starbucks won the Internet with this viral drink, and it boosted their sales – the average Starbucks store saw more than 20 people buying the Unicorn Frappuccino each day it was available.
Starbucks’ example shows that looks matter – and we decided to put this hypothesis to the test. Taking our previous study of LTO ideas in the quick-serve restaurant (QSR) space, we tested real promotional materials for these same LTOs. We wanted to see if and how people’s choices change when they see campaign creative for an LTO vs reading the name and description of those same LTOs.
We conducted a study with 500 Americans and 500 Canadians that analyzed promotional and new product LTO creatives from different brands within the sandwich and beverage categories. We then compared the results with the data we got from our study of those same LTO names and descriptions..
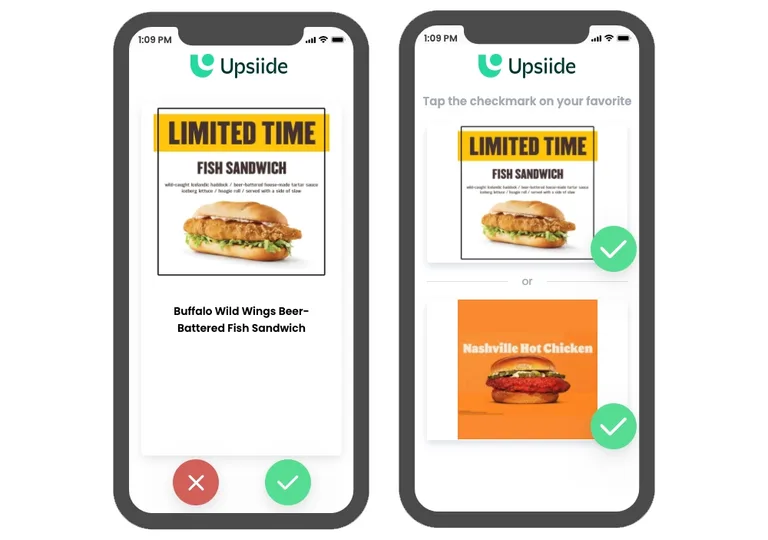
Before we dive in, let’s run through the different scores on the Upsiide platform:
The Interest Score is the proportion of people who liked an idea (in this case, an LTO) and is expressed as a percentage. When respondents like two ideas, they are asked to trade-off between them, picking a favourite – which generates the Commitment Score. Finally, the Idea Score is based on a combination of the Interest Score and the Commitment Score – it’s an absolute score that’s been calibrated to predict the performance in-market.
Okay, time to check the results!
1. Creative appeal impacts interest in a new menu item
The quadrant charts below categorize the sandwich and beverage LTOs into four brackets, according to the balance between their ‘Total Interest’ – how many people swiped right – and their Commitment Score – how often they chose a specific idea when pitted against another idea that they liked.
Sandwiches:
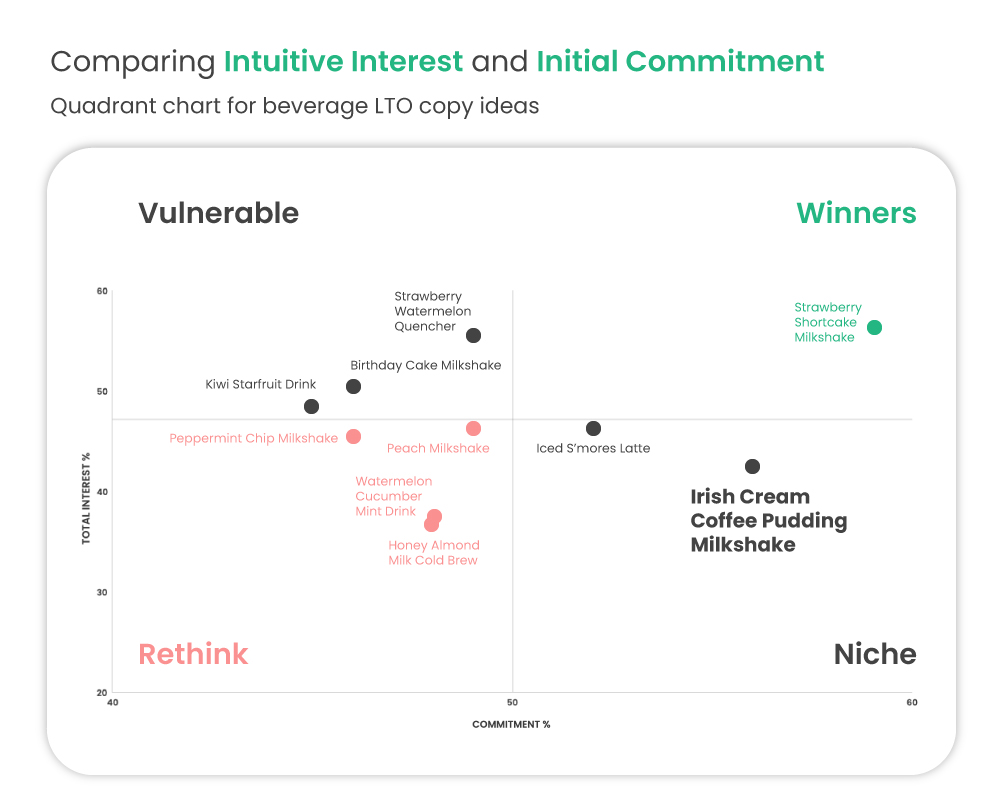
When we tested sandwich LTOs names and descriptions in isolation, we discovered that the Beer-Battered Fish Sandwich sits in the Niche quadrant with low interest but high commitment. This means that a certain group of consumers are really loyal to this LTO concept and pick it over most other sandwich LTOs.
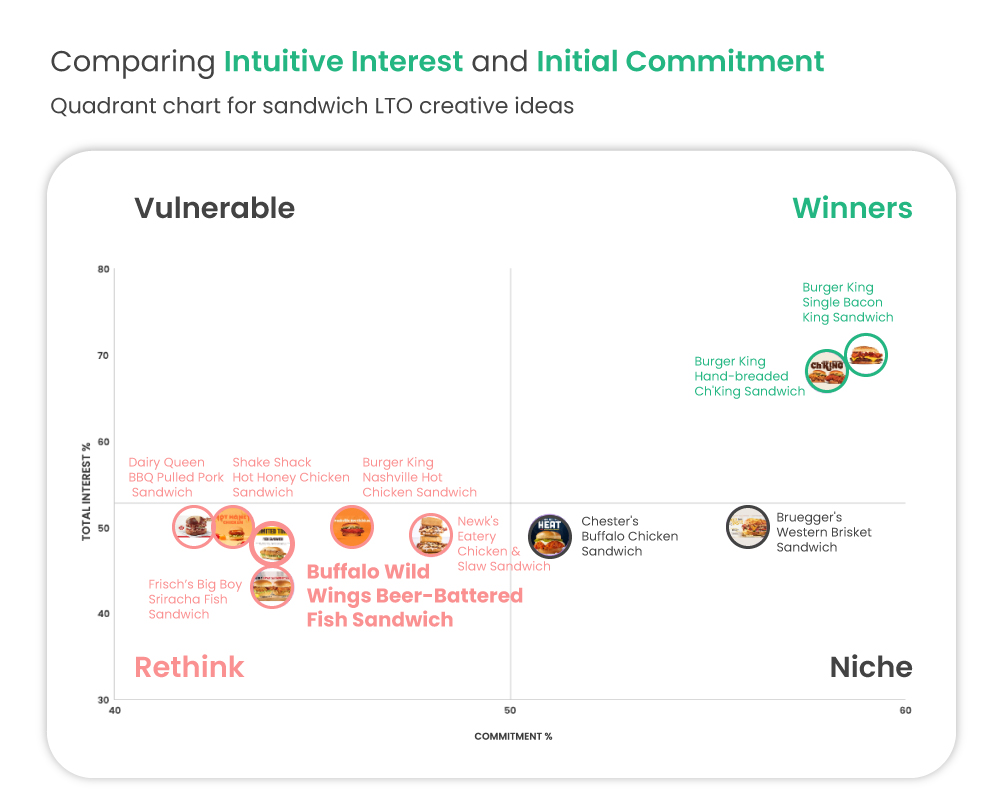
But what happens when we test the creative? Well, the results aren’t as promising. The Beer-Battered Fish Sandwich moved down to the Rethink corner, meaning that consumers didn’t find this LTO compelling. While we don’t know exactly why this happened, we assume that the presentation of the sandwich and supporting creative didn’t entice consumers to try this LTO.
Beverages:
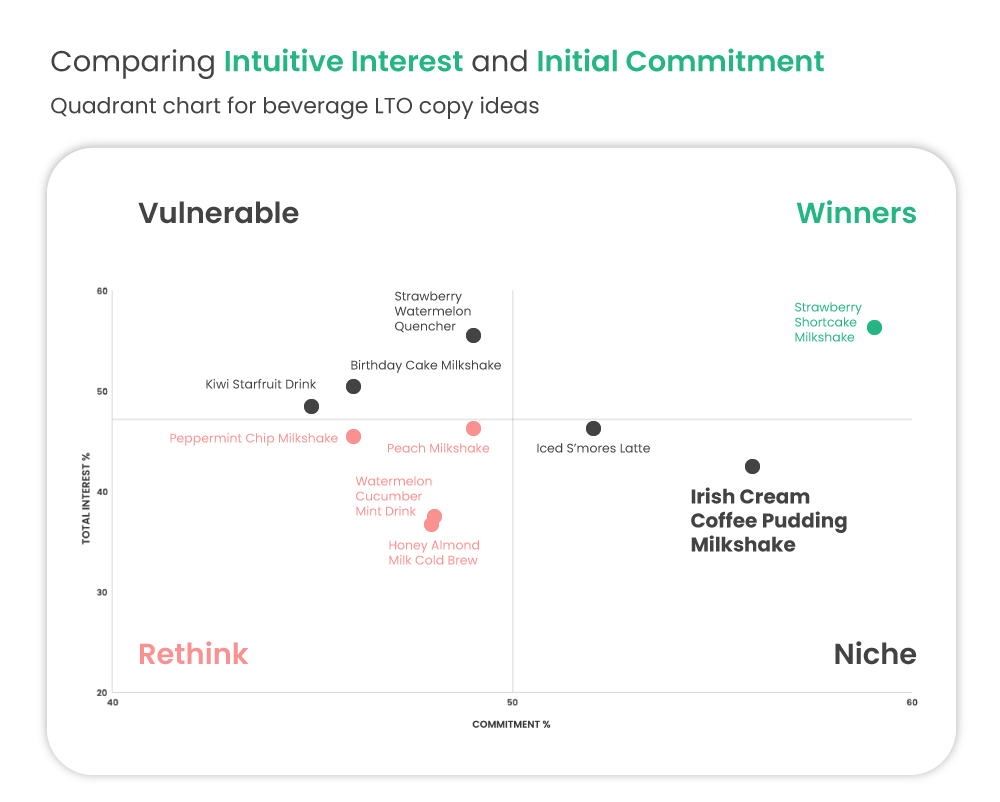
Another Niche LTO, however, experienced a different transformation in the creatives test. Starbucks’ Irish Cream Coffee Pudding Frappuccino moved up to the Winners quadrant, getting high interest and commitment scores.
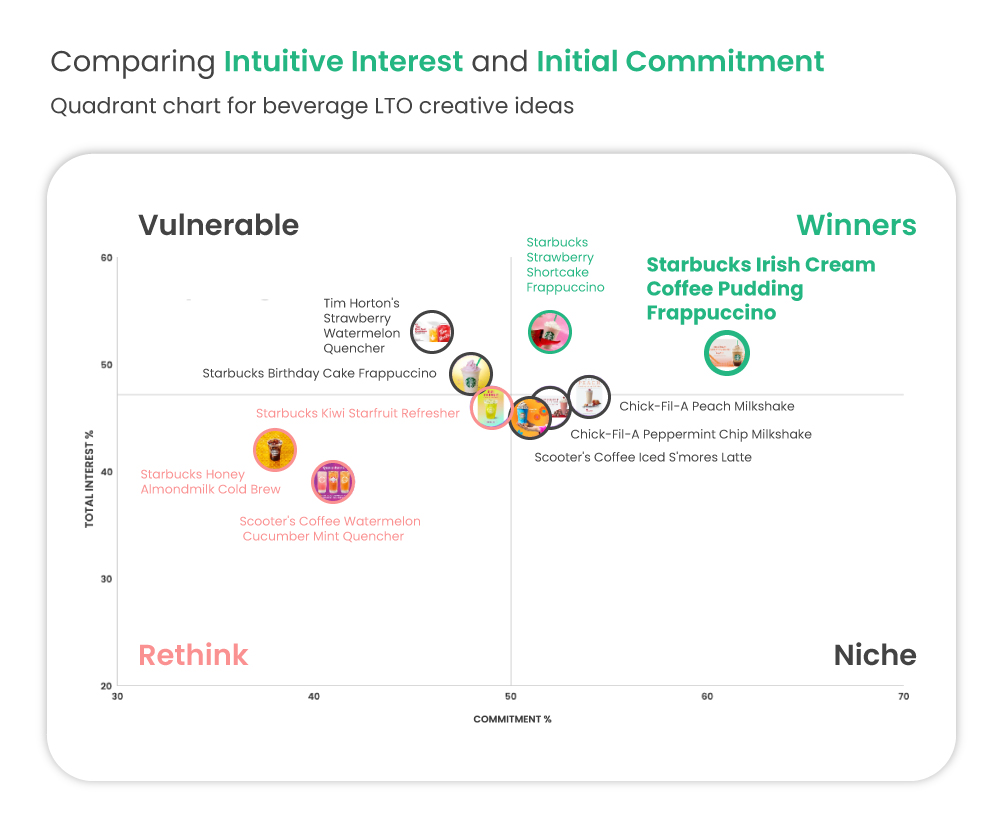
It’s interesting to see that consumers weren’t as interested in the concept for the Irish Cream Coffee Pudding Frappuccino in the copy test. But when they saw what the menu item looked like, the interest rate spiked. Our guess is that the description for the Irish Cream Coffee Pudding Frappuccino didn’t have the same impact as the way it looks.
What a QSR brand can learn from this insight is that results might differ depending on what you’re testing and how optimized your test materials are. Brand also comes into play; given Starbucks’ success with novelty drinks, testing the Irish Cream Coffee Pudding Frappuccino in a Starbucks cup might have made more people want to give the drink a try.
2. Regardless of age, people are drawn to indulgent beverages with a retro vibe
We analyzed beverage LTOs and found some interesting patterns. We’ve grouped those patterns into 3 territories. In the test we ran with names and descriptions, those territories were:
- Nostalgic
- Fruit
- Coffee based
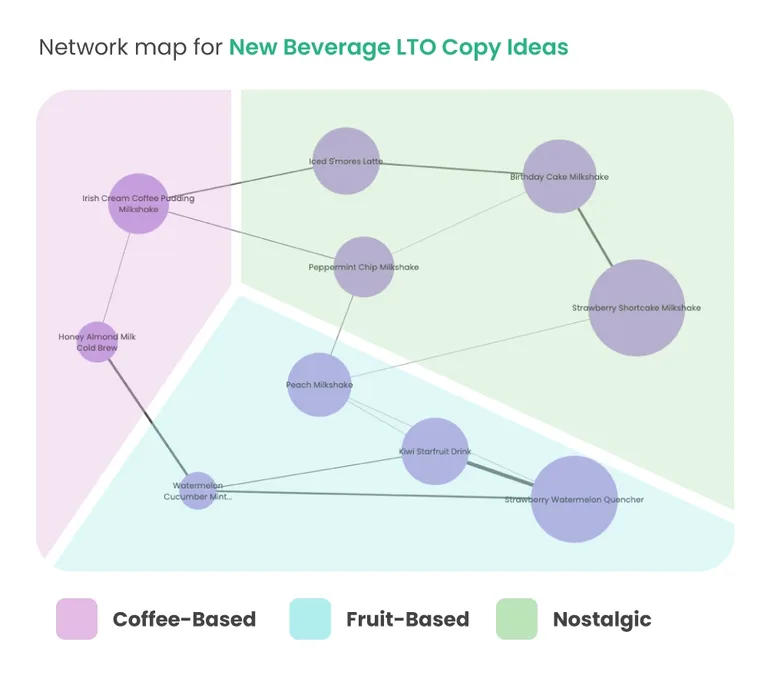
In the test we ran with campaign creative, we called these patterns:
- Milkshake/Whipped Cream
- Fruit
- Plain Coffee
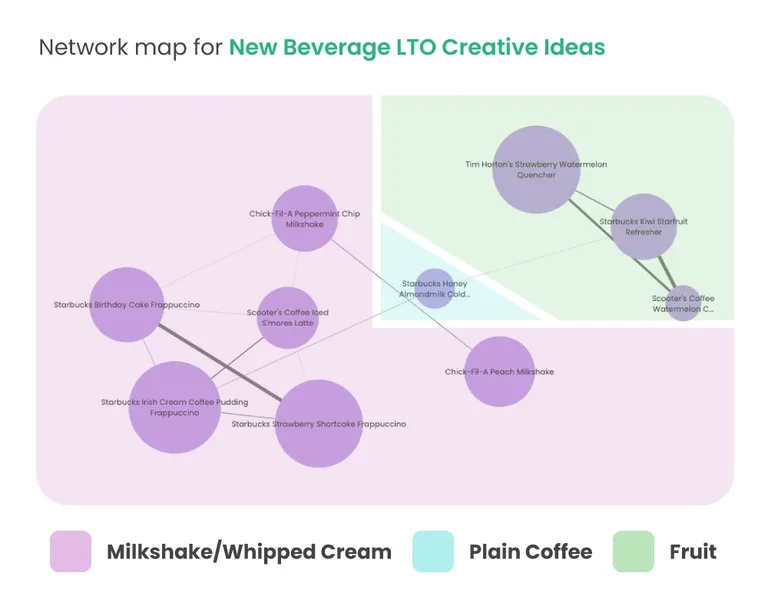
You might notice that the ideas in the Nostalgic territory are almost the same as in the Milkshake/Whipped Cream territory. And ideas in those territories performed best in both tests.
To understand what this means we want to ask you a simple question – what do you associate with milkshakes and whipped cream? Some think of American diners, some might remember slurping on their favourite milkshake as a kid, or asking their parents to put some whipped cream on top of their waffles or ice cream sundaes. Doesn’t it make you long for those old days? Regardless of whether or not people see a name and description OR a creative mock upf, they are most drawn to drinks that remind them of their favourite childhood milkshakes.
And this trend is visible across both younger and older generations. When we look at 18-34-year-olds, we notice that Starbucks’ Birthday Cake Frappuccino gets a Commitment Score of 56% compared to the average score of 48%. Similarly, people over 50 preferred Chick-Fil-A’s Peppermint Milkshake over other drinks. Both of these beverages are associated with celebrations and holidays and fall into our ‘Nostalgic’ territory.
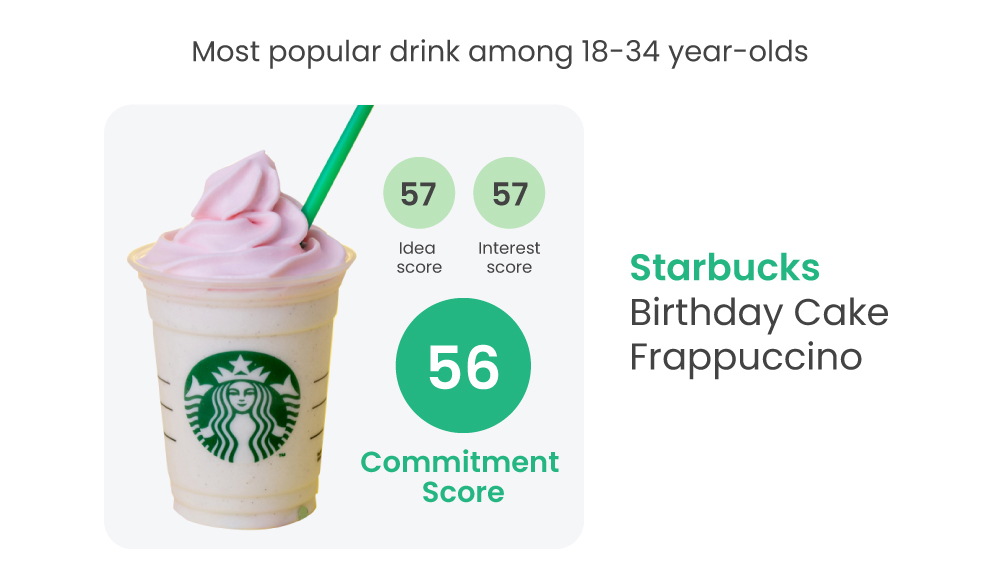
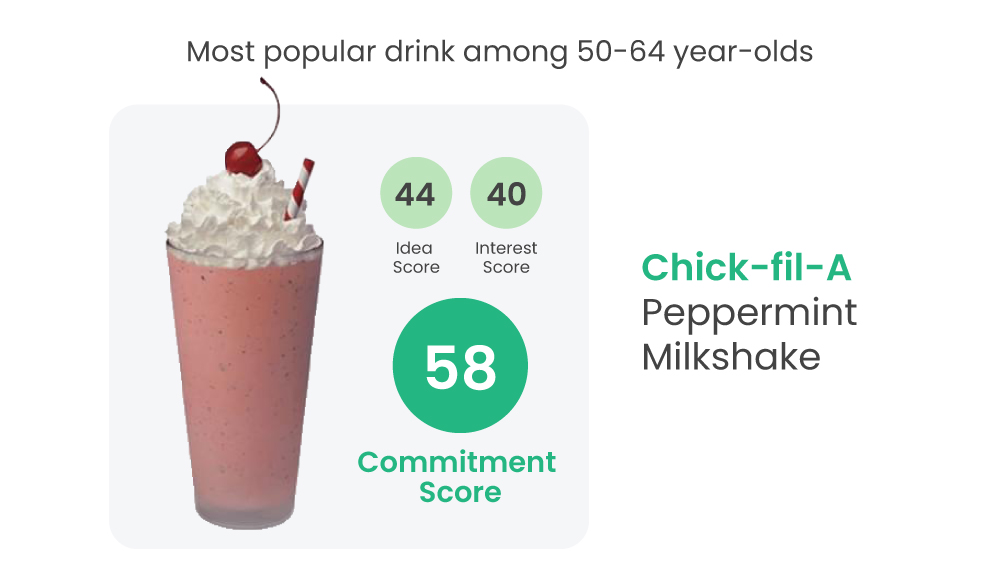
This insight makes you realize why Frappuccinos (read: fancy milkshakes) have been one of Starbucks’ major differentiators – the company continues to tap into the kid inside all of us, reinventing the classic milkshake over and over.
The lesson? If you’re looking to capture a larger volume of consumers, try to do the same in a way that works for your brand and category. ‘Nostalgic’ can mean many things.
3. Sandwich LTOs should highlight texture
When we tested names and descriptions of sandwiches, we discovered that consumers were interested in popular meats like chicken, beef and pork. But the creative test showed that people also have a specific vision of how they want their meat – crispy.
Have a look at the most popular sandwich LTOs. Burger King’s Crispy Bacon Sandwich and Hand-Breaded Ch’King Sandwich (Chicken Sandwich) performed best in both tests. If we look at the descriptions and creative for these two sandwiches, we see that both highlight crispy texture verbally and visually. The Crispy Bacon Sandwich is described as “crispy” and “grilled”, whereas the Hand-Breaded Ch’King Sandwich features a crispy chicken filet covered with toasted breadcrumbs.
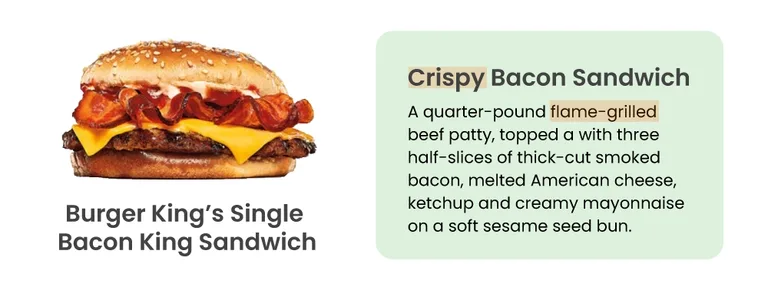
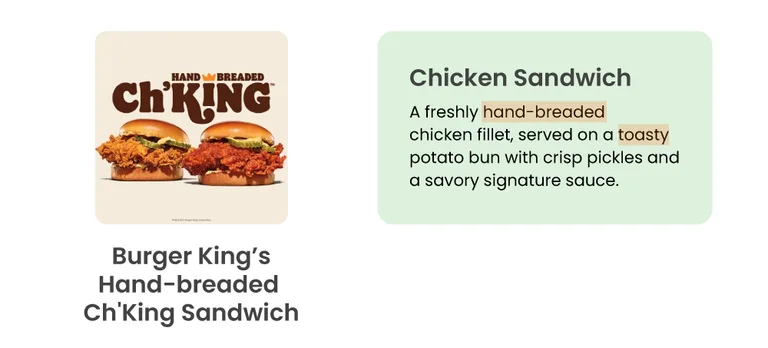
So what does this mean? Just like in the case of beverages, people know what they want when it comes to sandwiches. QSR brands can lean into the desire for some added crunch in their descriptions and visuals of the offers themselves.
4. When it comes to saving money, enticing creatives and copy becomes less important
Having tested a range of promotional sandwich LTOs, we discovered that whether you test the promotional offer as copy or in a creative mockup has little bearing on the results.
The promotional offers ranged from $1 to $8, and it turns out that consumers preferred cheaper sandwich LTOs. In fact, the ranking of LTOs was identical in both Upsiide studies we ran, using names and descriptions as well as creative.
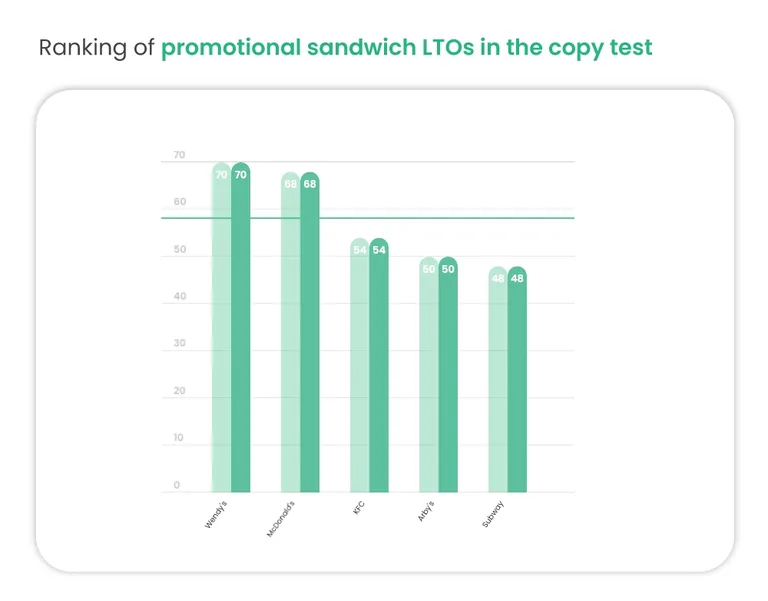
The takeaway? Nail the offer itself, and make sure that it fulfils the cost-related need, before testing alongside descriptions or creative.
5. Brand presence in the geographical markets affects consumers’ choices
When we tested the LTOs as creatives, they were of course branded (unlike the names and descriptions we tested previously). Our simultaneous tests demonstrated that brand association and presence played a key role for respondents when it came to their interest in purchasing the LTOs.
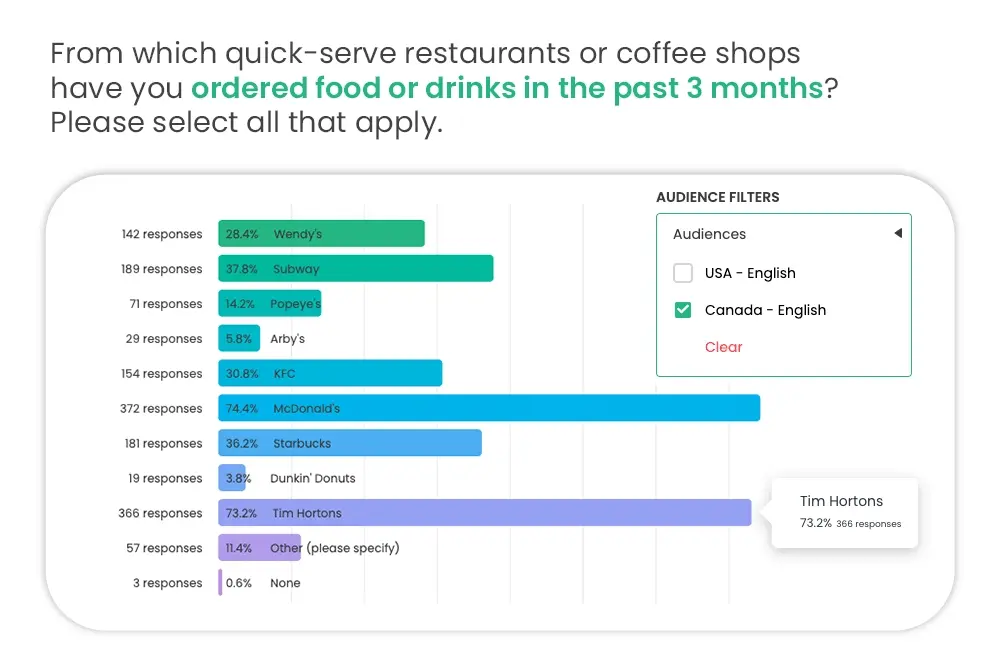
When we asked consumers which QSR and coffee chains they’ve ordered from in the last 3 months, we noticed that Canadian audiences chose somewhat different brands to the US consumers.
Tim Hortons is a good example of that in practice. Over 73% of Canadians indicated that they’ve ordered at Tim Hortons in the last 3 months. But this percentage drops drastically with the US audience – only 6.6% ordered from Tim Hortons. This result checks out because Tim Hortons has 3,530 stores in Canada and only 622 in the USA.
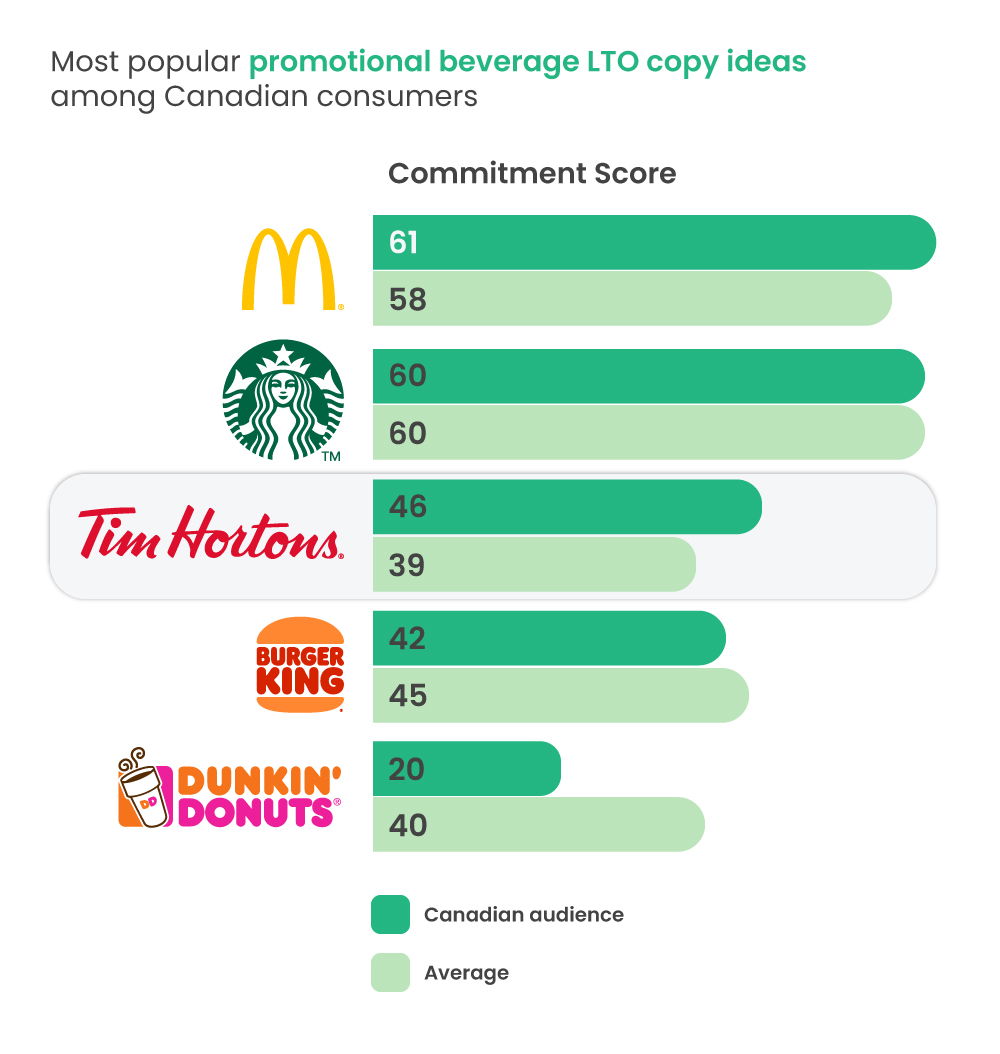
Restaurant and brand presence then affected consumers’ choices of LTOs in both tests. In the names and descriptions test (without creative), Tim Hortons got a Commitment Score of 46% with Canadians, and 28% with US audiences.
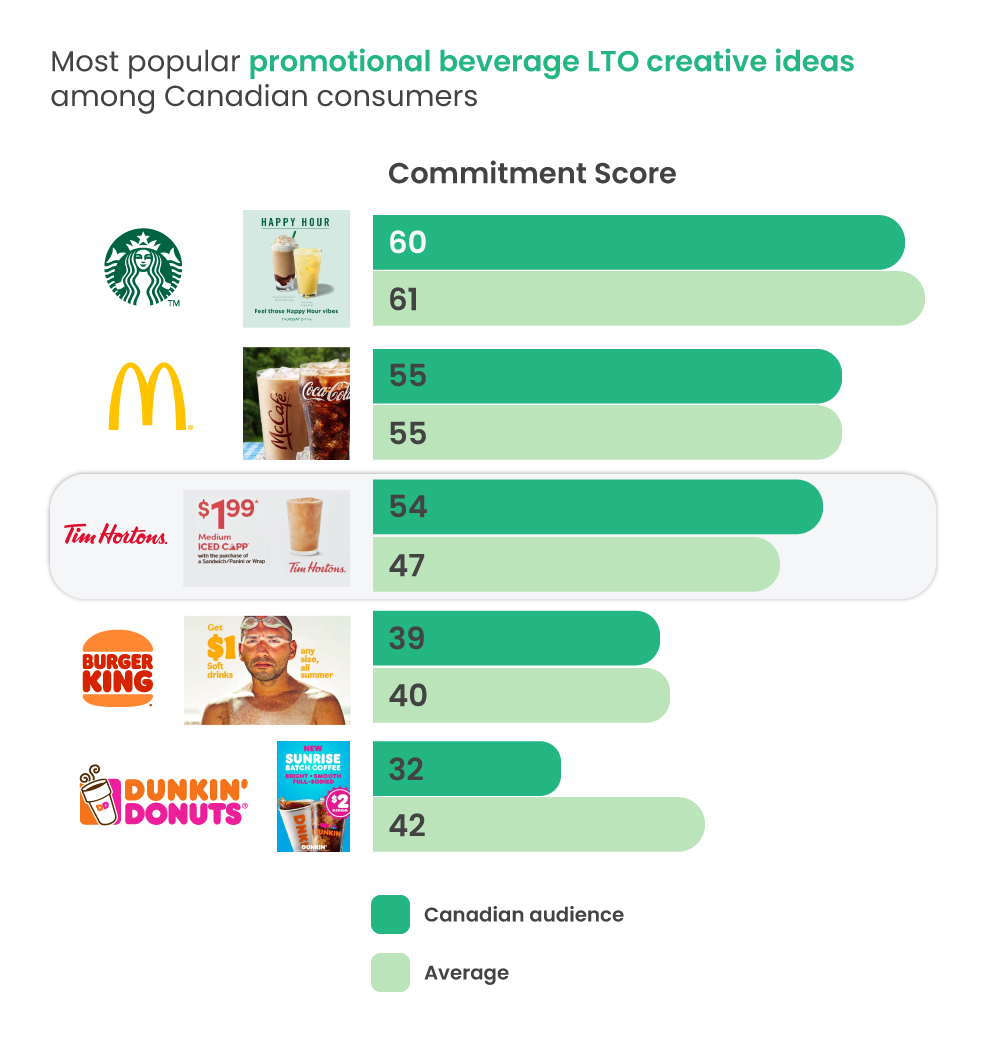
In the creatives study, Tim Hortons got a Commitment Score of 54% with Canadians and only 37% with Americans.
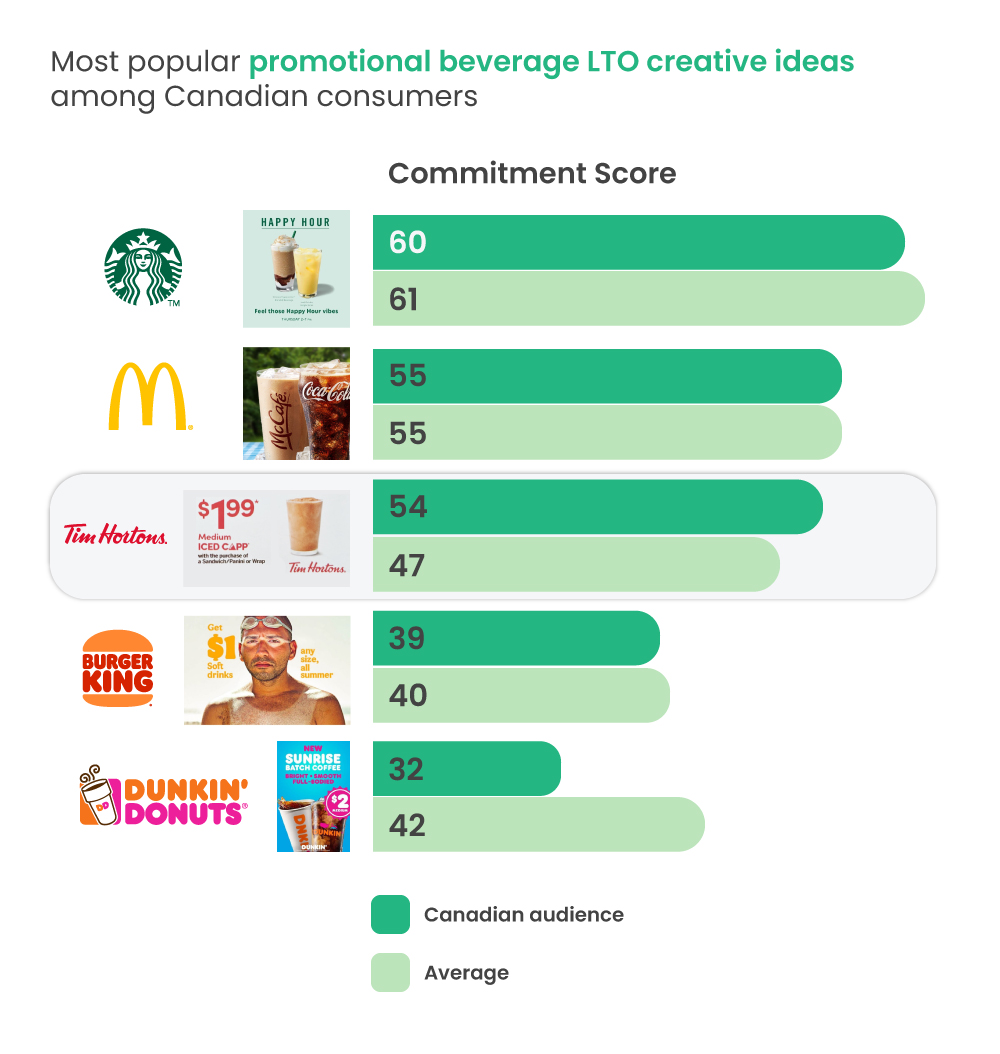
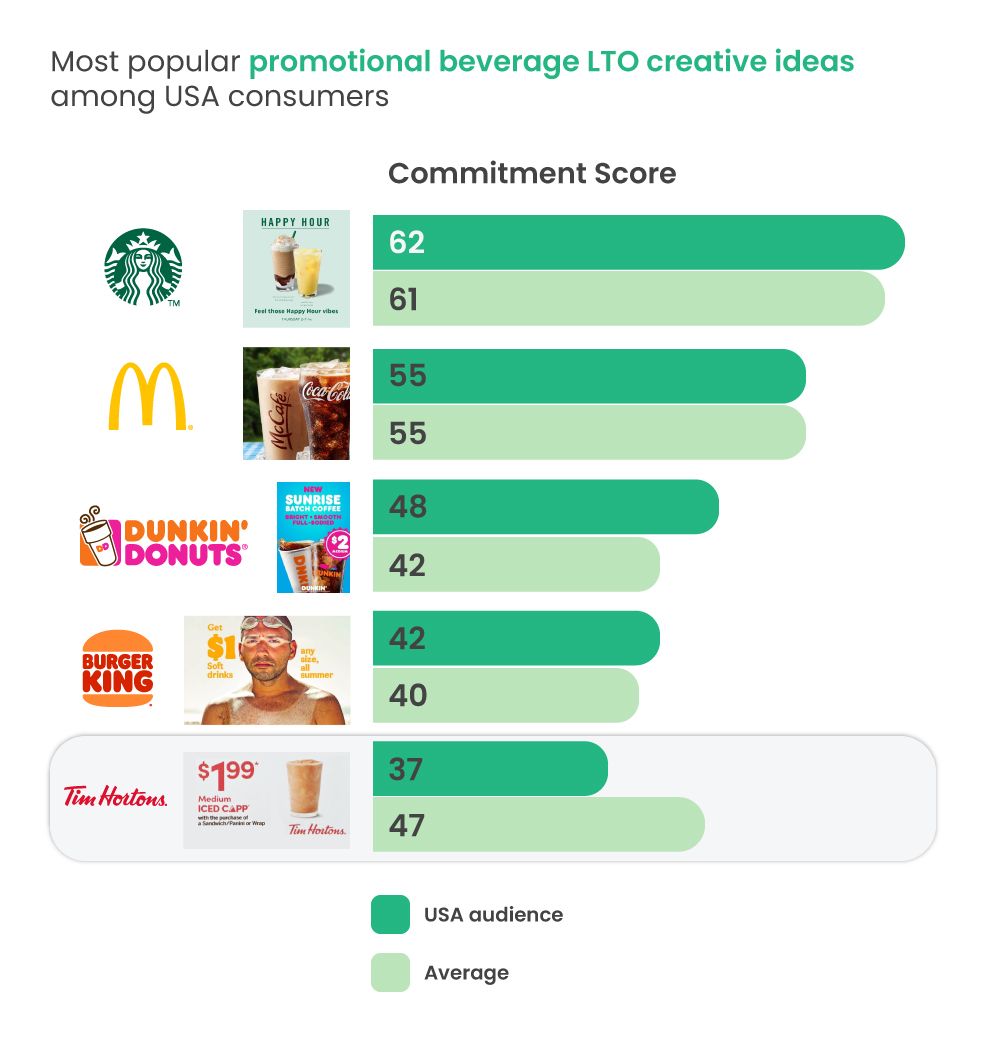
In our assessment, Canadians chose Tim Hortons over other brands because they are exposed to the brand more often.
The lesson? People are more likely to give your LTO a try if they’re familiar with your brand.
Final thoughts
There are so many other things we’ve discovered about testing descriptions vs testing creative. Want to learn more about how we used Upsiide to test ideas? Contact our team for a walkthrough.